UConn Office of Sustainability

Promoting sustainability at UConn


Leave a comment

New Energy Dashboards: Real-Time Green Building Data at Your Finger Tips

Energy dashboards, the latest addition to UConn’s top-ranked green campus, are interactive kiosks that allow anyone to explore real-time electricity, water, steam and chilled water usage statistics. This “green touchscreen” technology has been installed in both Laurel Hall and Oak Hall. It is available to any student, staff or faculty member.

Green Touchscreen Screenshot (Widgets)

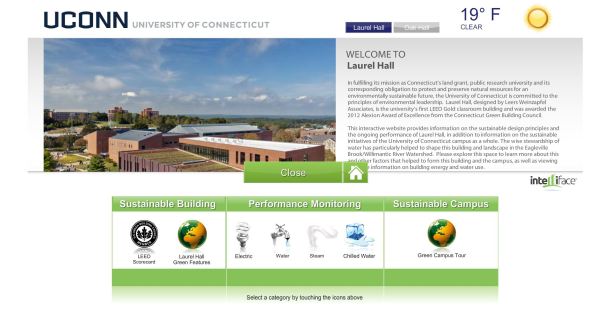
By touching the energy dashboard display, anyone will be able to discover how many gallons of water have been consumed so far in a day, or the number of gallons of water that were used the day or two before. A student, staff or faculty member would also be able to explore the sustainable features of the building, as well as all of the sustainable initiatives of the University of Connecticut campus as a whole by touching the green campus tour widget.

Green Touchscreen Screenshot (Laurel Hall)

Better still, the energy dashboard does not only have to be accessed in person. Anyone can access the energy dashboard online. By visiting the interactive website, anyone can explore information on the sustainable design principles and analyze trends in water, electricity, steam and chilled water usage – the same information that can be accessed at the kiosk in Lauren Hall and Oak Hall. The energy dashboards not only serve as an extraordinary educational tool, but they raise awareness about our environmental impact. By making real-time energy statistics available to the community, both students and staff will be able to apply conservation tips to their own lives and ultimately make a difference in reducing the size of the University’s carbon footprint.

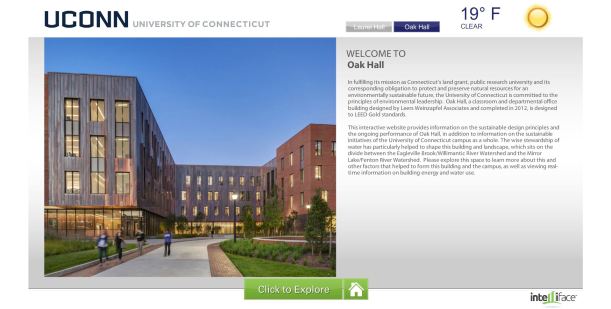
Green Touchscreen Screenshot (Oak Hall)

Our analysis of similar installations at other colleges and universities has shown that the most widespread use of dashboards and touchscreens occurs when faculty members, from a variety of disciplines, incorporate class projects that utilize them into their syllabi. We encourage UConn professors to take full advantage of the new dashboards as teaching tools for environmental sustainability! If you’ll let us know how you plan to use them in your class, we’ll maintain and publish an inventory of different academic applications.  We’d also appreciate your comments and suggestions for improvement about the content and user-friendliness of the dashboards.  Please send your input and feedback to envpolicy@uconn.edu.

– Meredith


Leave a comment

UConn Philanthropy Day 2013

Today marks the University of Connecticut’s 4th annual Philanthropy Day! This yearly celebration reminds us to thank friends, alumni and other donors of UConn for their philanthropic efforts and investments. Many of our donors give loyal, annual support and others give considerable one-time gifts. But, either way, every gift and donation significantly helps support various organizations, programs and initiatives on the University of Connecticut campus. In total, the University has over 34,000 donors, and thousands of those are our very own UConn alumni. In 2012 alone, our donors gave more than sixty-two million dollars, a third of which supported scholarships and other academic initiatives.

It is very important to take a moment of recognize and pay tribute to those who have made generous contributions to the University. Without their charity, several programs on campus that we all enjoy, benefit from and take for granted could not have been continued.

Here, at the Office of Environmental Policy, we would like to express our thanks not only to all University of Connecticut donors, but especially to our Campus Sustainability Fund donors. Your donations have absolutely helped the University earn the status as the “Coolest School” in the nation. Your donations have also helped the University fund many sustainability events and programs. UConn could not have made this achievement without your loyalty and support to the Campus Sustainability Fund. So today, on Philanthropy Day, we would like to give all of you a tremendous thank you! 

CSFLogo


Leave a comment

EV Charging Station

The University of Connecticut was one of eighteen locations selected by Connecticut Light & Power (CL&P) for their “Plug My Ride” program. There is already one electric vehicle charging station on campus located in the Motor Pool parking lot. It is open to the public for free use between the hours of 8:00AM and 4:00PM.

Image

Over the past year, CL&P and the University’s School of Engineering conducted a study on the charging station and concluded that it was in the top 5% for usage among all of the charging station included in the study (more information about the Plug My Ride Case Studies can be found here: http://plugmyride.org/Case_Studies.aspx). Recently, UConn’s Department of Transportation (DOT) and student interns at the Office of Environmental Policy (OEP) collaborated to acquire a grant for the installation of two more electric vehicle charging stations. The Connecticut Department of Energy and Environmental Protection (DEEP) agreed to fund the installation of two more electric vehicle charging stations on campus. The two additional charging stations are to be installed in both of the parking garages – one in North Parking Garage and another in South Parking Garage.

Image

The existence of two more electric vehicle charging stations will further promote the use of hybrid and electric vehicles. The additional charging stations will also provide the University with the potential to purchase more electric vehicles in the future to improve the fuel efficiency of its fleet, and will prompt the possibility of adding more electric vehicles to the “Hertz on Demand” car sharing program. Not only do electric vehicles contribute to cleaner air quality and lead towards a more sustainable planet, but they are also economically advantageous and energy independent.

– Meredith


Leave a comment

EcoMadness Winners!

The final results of EcoMadness 2013 are in, and we have our winners!

Congratulations, Allen/Kingston, Beecher/Vinton, Sprague and Holcomb!

Water

Throughout the entire competition, Towers claimed first place in the water reduction category. During the first week, Beecher/Vinton was in first place, but for the rest of the competition, Allen/Kingston continued to represent Towers and overtook the water reduction category. By the end of the competition, Allen/Kingston had managed to reduce their water consumption by a very impressive 10.3%.  Sprague ended up remaining in second place for a majority of the competition, finishing with a 9.6% reduction. Similarly, Hanks of Northwest campus remained in third place for most of duration of EcoMadness and finished with a 4.9% reduction. Sprague also placed as a leader in per capita water usage with 31.9 gallons of water used per student, followed by two Northwest campus dormitories – Terry and Hanks – with 33.3 and 33.9 gallons of water used per student.

Energy

Towers, again, took over the energy reduction category for most of the competition. During the first, second and third week, Beecher/Vinton, Hamilton/Wade/Fenwick/Keller and Allen/Kingston of Towers placed high in the leaderboards.  Sprague and Shippee also placed in the energy reduction category. At the end of the competition, Beecher/Vinton placed first, Whitney placed second and Shippee placed third with a 6.4%, 6.3% and 5.2% reduction, respectively.  Holcomb, Hollister A/Hollister B and Buckley were the leaders in per capita electricity usage. Students in Holcomb used 3.2 kWh, students in Hollister A/Hollister B used 3.3 kWh and students in Buckley used 3.4 kWh of electricity.

EcoMadness Kick Off Party in East

EcoMadness Kick Off Party in East

EcoMadness Kick Off Party in NorthWest

EcoMadness Kick Off Party in NorthWest


The reductions were close, all around, with only a few gallons and kWh separating first from second and third place! Overall, however, it is thrilling to be able to see so many dormitories reduce their water and energy consumption throughout the entire course of EcoMadness. Although the competition is over, continue to keep up the great work and remember to keep conserving! And, to the winners of EcoMadness 2013, be sure to enjoy your ice cream party! You should be proud of yourself for demonstrating excellent conservation and sustainable lifestyle practices throughout the entire four weeks of the semester.

– Meredith


1 Comment

Preparing for EcoMadness

Here at the Office of Environmental Policy, we are in the midst of preparing for this year’s EcoMadness Event.  During the month of EcoMadness, participating residence halls contend in a race to reduce their energy and water usage.  The 7th annual EcoMadness competition will kick off next week, beginning on Sunday, September 29.

There are several ways to measure energy efficiency. Observing trends in the consumption of water and electricity are only a couple of the various approaches. Imagine being able to access this kind of information at any point of the day, and being able to look back at previous energy consumption trends throughout the week, or even throughout the month. Are you a resident of Buckley, and have you ever been curious about the amount of water the entire dormitory consumes at any given day? Or, maybe you are a resident of Whitney, and are curious about how having a dining hall included in your dormitory affects total water and energy consumption?

Unbeknownst to most of the campus community, these kinds of energy statistics are available to anyone online at the campus energy dashboard. Located as a part of the UConn Facilities Operations webpage (http://www.fo.uconn.edu/cogen.html), the campus energy dashboard, graphically and statistically, tracks various trends in water and electricity usage for buildings and residence halls on campus. At the Office of Environmental Policy, the campus energy dashboard is accessed on a regular basis. The energy statistics are compiled into spreadsheets to ultimately be used to determine the baseline water and electricity figures for the dormitories participating in EcoMadness. When EcoMadness begins, the campus energy dashboard will still be accessed in order to compare current water or electricity consumption figures to the baseline consumption figures. The dormitories that show the greatest reduction in consumption will be rewarded (with ice cream), although any reduction will be applauded (because conservation is its own reward). The primary goal of EcoMadness is to instill a behavioral change in students that will cause them to be mindful of how their everyday actions impact their carbon footprint and the environment.

By accessing the campus energy dashboard, you can always check to see how much water and energy your building is using on a daily basis. You can even compare these values to your competition’s water and energy use (We should note that our office has to make some adjustments for additional features like emergency lighting and dining halls for the official competition results).  In the future, the energy dashboards located in Oak and Laurel Hall will also be able to provide anyone on campus with access to data on water and energy consumption.  In the meantime, though, it’s time to go green with EcoMadness! Stay blue, UConn.

– Meredith and Brianna


Leave a comment

The Difficult Road to #1

UConn’s recent achievement in reaching the #1 ranking in this year’s Sierra Club “Cool Schools” Survey is, without a doubt, a success to be celebrated by the entire campus community. The sustainable practices implemented by faculty, staff, and students, as well as generous donations to the University’s Campus Sustainability Fund, have  supported green initiatives here at UConn.

However, as one of the newest at the Office of Environmental Policy, it especially excites me to have been a part of such an outstanding accomplishment within my first year as an intern. I can remember the meeting when the previous sustainability coordinator, Jen Clinton, began assigning sections of the Sierra survey for us to review, fact check and update. There was a collective groan that went through the room, and little did I know what I was about to get myself into. The subsequent process of reviewing our designated sections, which took several months, was often stressful. Meeting deadlines while balancing other tasks assigned to us in the office, including planning and running events such as Green Game Day, also proved to be a challenge, and when the survey was finally submitted, all of us could breathe a little sigh of relief.

Still, the long wait for the Sierra club to review our survey and respond to us with our ranking was nerve-wracking. A majority of the other interns had been through the process of submitting the survey before, but although it was my first year, I was able to share their anticipation. We all wanted to see the fruits of our labor pay off, not only because we had devoted hours of hard work, but because we knew UConn deserved nothing but a high ranking. The feeling of excitement that struck us all when we received the great news was indescribable. We were extremely proud of one another, and proud to say that we belong to such a “cool school”! If we were able to achieve this kind of success during my first year at the OEP, I can only imagine the other accomplishments that lie ahead for the University. Congratulations, Huskies!

– Meredith


Leave a comment

Energy Dashboards as a Sustainability Tool

There are several ways to measure energy efficiency. Observing trends in the consumption of domestic and chilled water, electricity, steam and greenhouse gas emissions are among the various approaches. Imagine having the technology on campus that would allow anyone to access the energy statistics for a particular building on campus at any time of the day. Anyone would be able to see how many gallons of water were consumed within the past hour, the past day or even the past week. Or, you could find the kilowatt hours of electricity used earlier in the week, and then compare the data figure to the day prior. The University has installed a new form of green technology into Oak and Laurel Halls that will bring this idea to life. The new technology is called an energy dashboard. It is an interactive kiosk that allows anyone to interact with various widgets on the touch-screen display. By touching any of the widgets, students, staff and faculty will be able to explore real-time energy usage statistics, as well as information about the building’s sustainable features and a green campus tour.

Energy Dashboard Display in Laurel Hall

Energy Dashboard Display in Laurel Hall

Alone, the energy dashboards do not save energy. The system displays energy statistics that are in turn left to be interpreted and acted upon by the campus community. For instance, if Oak Hall were to experience a significant spike in water usage from one day to another, it would be the responsibility of the students and staff to be mindful of the amount of water they consume. Therefore, the University hopes to ultimately instill behavioral change. A crucial part of this process is education. The energy dashboards can be incorporated into the classroom environment as professors include them in their curriculum. They can be used as a classroom tool for a variety of courses ranging from Environmental Science, Ecology Agricultural and Resource Economics and Conservation Biology to Civil and Environmental Engineering and Natural Resources. By drawing from actual, real-time data, professors can supplement their lesson plans by having their students analyze certain energy statistics and create their own solutions. For example, if a building experienced an increase in electricity usage, students would be tasked with deducing a probable solution.

At UC Berkeley, the myPower program was launched as a comprehensive program to reduce the amount of energy the campus consumes.  It is also a means to empower the entire campus community to take smart, simple energy saving measures that will shrink environmental footprint and save money. In return, the money saved is sent back as funds for teaching and research purposes. The myPower program also marked the beginning of an online energy dashboard that allows anyone to see how much electricity is being consumed in a particular building at that very moment. The energy dashboard extends to fifty-seven buildings and is a part of the university’s new initiative to reduce energy use. UC Berkeley, like UConn, aims to instill behavioral change in the campus community by launching the myPower program. In turn, case studies and energy surveys have been initiated to highlight how the energy dashboards complement existing sustainable initiatives. UC Berkeley, since the implementation of the myPower program, has experienced high annual savings, enhanced research opportunities and a considerable educational value.

Energy dashboards not only serve as an extraordinary educational tool, but they raise awareness about our environmental impact. By making real-time energy statistics available to the community, both students and staff will be able to apply conservation tips to their own lives and ultimately make a difference in reducing the size of the University’s carbon footprint.

– Meredith


2 Comments

Recycling at UConn

Paper, plastic, glass, aluminum, bottles and cans – what do all of these materials have in common?  Did you know that all of them can be disposed of in the same recycling bin? Three years ago, the University of Connecticut, with the help of WilliWaste, revitalized its twenty-year-old recycling program and adopted a single-stream recycling system. The goals of the new program are to save even more energy, reduce more waste and further the prevention of pollution. In 2010, it was determined that faculty, staff and students at UConn recycle only about 20% of the disposable materials that they use each day. Since then, UConn has set a new goal of at least 58% by 2024. To expedite the University’s progress towards the lofty, sustainable goal, more than one hundred outdoor recycling bins have been added across campus. Just like the indoor recycling bins, any bin can accept any recyclable material.

Data shows that, since single stream recycling was implemented in 2010, the new program has been successful. The amount of waste tonnage by bottles, cans, and newspaper has significantly decreased as students and staff have started discarding all recyclables into the same container. The amount of waste tonnage by mixed paper and corrugated plastic has also decreased. Therefore, the amount of single streamed waste has grown and continues to do so. The University of Connecticut hopes to see the amount of waste tonnage for single stream recycling increase over the next few years. Ultimately, we wish to achieve our goal of having over half of our disposable materials recycled.

More can be recycled than you think!  Books, aluminum foil, and aerosol cans can all go into any recycling container.  There are also e-waste containers in several campus locations (Library, Student Union, Co-op) for printer ink or toner cartridges, batteries, and broken electronics.

Today, in 2013, the University has worked diligently to change the way the campus community views the importance of recycling with various events and programs. If you would like to help UConn further its waste reduction initiatives, get involved in the programs meant to promote the importance of recycling to students and to the community.  Each year, the Office of Environmental Policy (OEP) teams up with athletics to host three Green Game Days – one football game during the fall semester and two basketball games during the spring semester.  At these events, student volunteers encourage fans to recycle their used items instead of throwing them into garbage cans. Volunteers also collect recyclables from tailgate areas at football games, as well as lightly used shoes for donation at basketball games.  However, lightly used shoe and sneaker recycling is not a one day event.  Throughout the entire spring semester, lightly used shoes and sneakers are collected and donated to the student group Kicks for Africa. The shoes are then shipped and distributed to less fortunate children in African countries.

For other waste reduction, UConn runs a program called Give & Go at the end of each year. Give & Go is an opportunity for students to donate furniture, clothing, school supplies and nonperishable food items as they move out at the end of the semester (for a list of all collected and donated items, visit: http://ecohusky.uconn.edu/recycling/giveandgo.html) . The recycling and reuse program encourages students to donate unwanted belongings to local charities and non-profit organizations instead of throwing them away.  And of course we have regular surplus sales at the University Surplus store to send items the University no longer needs to a new home! (There’s one on Friday 8/9/13 – check it out!)

We don’t stop at reusing and recycling – we are also trying to reduce the amount of waste we produce.  The University has also opened a composting facility, and Dining Services has removed all trays from dining halls (with the exception of South Campus) to reduce the amount of food waste produced by students.  In addition to reducing the amount of food waste generated on the front end, any food that is disposed of is composted in eCorect machines located within the dining halls.  By composting organic waste, UConn is reducing the overall volume of waste while re-purposing it to divert waste from landfills.

Next time you have an empty bottle in your hand, remember to recycle it instead of tossing it into a garbage can.  Don’t be afraid to lift the lid of any recycling container and make use of UConn’s single stream program.  If you are unsure of what can and cannot be recycled, visit our recycling guidelines page or call the Office of Environmental Policy!

– Katie and Meredith